Platform Usage Trends
Platform usage trends show which screens get heavy traffic and which features sit unused, based on screen activity monitoring.
User session tracking shows login trends, screen activity, and usage patterns that point to where productivity is won or lost.
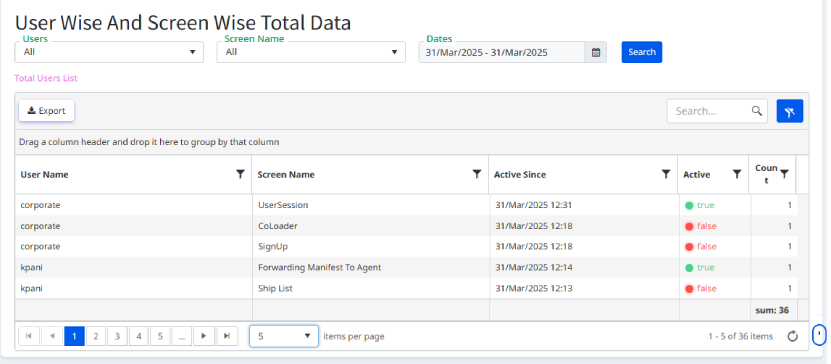
Courier software analytics that turn raw activity into decisions: which screens teams use, which they avoid, and where training would help most.
Platform usage trends show which screens get heavy traffic and which features sit unused, based on screen activity monitoring.
Login frequency analysis separates power users from occasional ones, which surfaces courier software analytics insights for training and team planning.
Adjust layouts using real user engagement metrics, so logistics dashboard optimization reflects how each team actually works.
Admin activity reports document what changed and when, ready for security audits and operational efficiency insights.
User behavior tracking shows where workflows slow down, so workforce productivity tools and coaching go where they matter.
Role-based engagement heatmaps map behavior by team and role, making it clear which dashboards need adjusting for whom.
Screen activity reports reveal which features carry the daily workload and which ones nobody touches.
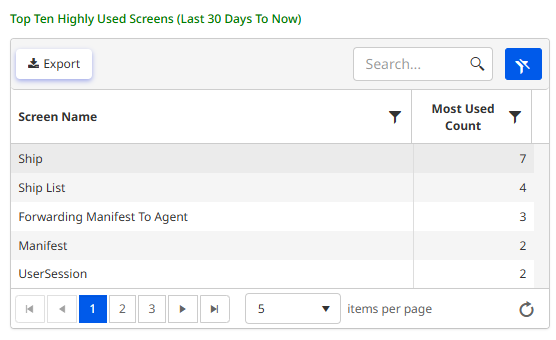
Screen activity reports rank the platform's screens by real usage. High-traffic features show where the daily work happens; rarely opened ones point to training gaps or features worth retiring.
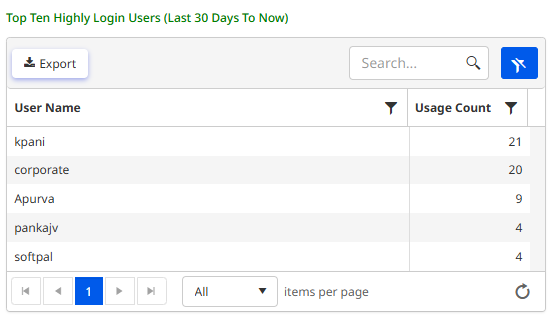
Login records show who leans on the platform daily and who barely signs in. Both matter: power users often hold process knowledge worth sharing, and low-usage accounts often need training.
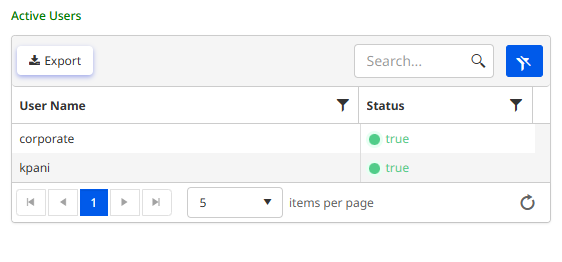
User behavior tracking feeds operational efficiency insights that support logistics dashboard optimization. Raw screen activity becomes concrete improvements: layouts to change, training to schedule, licenses to review.
The pipeline processes high volumes of interactions, turning raw activity into product intelligence your team can act on.
The lightweight SDK collects events without slowing the frontend, capturing user interactions across the platform.
Softpal Stream Engine groups behavior into sessions and calculates engagement metrics and usage patterns in real time.
ML models flag patterns and problems: rage-clicks, broken elements, unusual drop-offs. Nothing waits for a manual review to be noticed.
Automated reports suggest UX changes, with exportable admin activity reports and performance benchmarks behind them.
Product decisions based on actual user behavior and quantitative session data, not assumptions.
Typical improvement in user experience efficiency after acting on session data.
User sessions tracked concurrently with real-time engagement metrics.
Trend analysis with role-based filters and exportable reports.
The lightweight SDK leaves critical rendering and page performance untouched.
How Softpal's User Session Analytics platform works, in brief.
Softpal is built with privacy-first principles. PII (Personally Identifiable Information) is masked at the source, so sensitive user data never leaves the browser. The platform is compliant with GDPR, CCPA, and SOC2 standards.
The SDK is ultra-lightweight (under 12KB gzipped) and loads asynchronously, so it stays off the critical rendering path and does not affect cumulative layout shift.
Enterprise plans typically include 12 months of high-resolution data retention by default, extendable if your compliance requirements call for it.
Join over 500 enterprises using Softpal's user session analytics to turn raw activity data into product decisions they can stand behind.